Comparing Two-Part, Two-Proportions, Wilcoxon Tests
The following table documents under which conditions results for each of the comparative tests will be obtained.

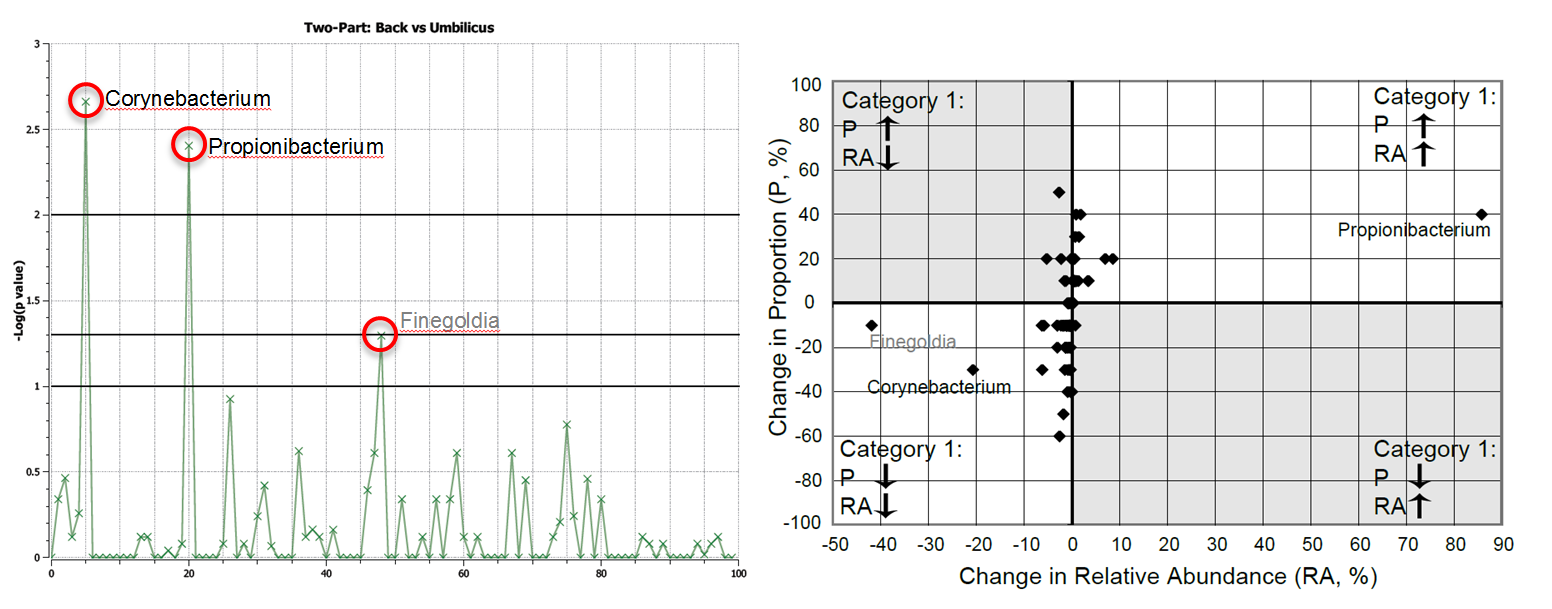
The following plot and chart demonstrate how to decide which of the three tests (Proportion, Wilcoxon, Two-Part) holds the most power for an individual dataset. For more information on how this plot was created, please view the Explicet tutorial.

The points farthest from the origin are labeled. The names in black were identified as significant; the points with grey text were not statistically significant. The two greyed out quadrants are situations in which the Two-Part test has power to identify significant differences (where the component statistics lose power due to the inverse relationship between proportion and relative abundance average out). While Finegoldia has a large change in relative abundance this is due to detection at ~41% relative abundance in a single umbilicus library. These data can be simplified by excluding taxa not present in a majority of libraries from either group. This graphic was generated by exporting the Two-Part test statistic data from Explicet and processing in Microsoft Excel.
